RentHop, an apartment hunting site that uses a combination of algorithms to sort apartment listings, released today a study on the average rent for one-bedroom apartments by each of the subway T stops across Boston.
The site mapped its results in the interactive map that you can see below:
To calculate the median rent for the map above, RentHop compared rental data for one bedroom apartments from the first quarter of 2016 and 2017, as well as MBTA data for T stops from Mass.gov. In 2017, rents increased at 101 stops across all train lines and went down at just 23 stops, according to the study.
Here are the T stops that saw the biggest rent increases for one bedroom apartments:
- Blue Line – Maverick – (+10.5%) $2,105
- Green/Orange Line – Haymarket – (+10.1%) $2,588
- Red Line – Butler – (+9.4%) $1,915
- Orange Line – Back Bay – (+9.1%) $3,377.50
- Green Line – Brookline Hills – (+9.0%) $2,125
And here are the T stops that saw the biggest year-over-year rent drops on one bedroom apartments:
- Green Line – Blandford St – (-8.5%) $2,525
- Orange Line – Assembly – (-8.3%) $2,210
- Green Line – Saint Paul St – (-7.5%) $1,850
- Red Line – Porter – (-7%) $2,000
- (TIE) Orange Line – Sullivan Square – (-6.5%) $2,150
- (TIE) Green/Orange Line – North Station – (-6.5%) $3,030
You can find more from RentHop's report here.
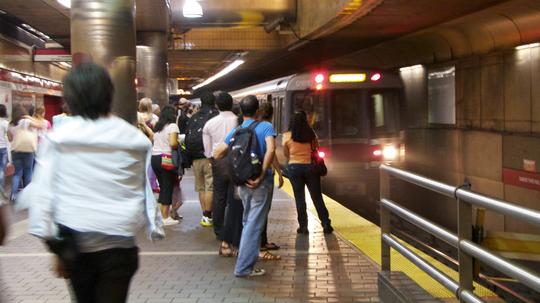
Feature Image credits: Scott Teresi, Flickr, under a CC BY-SA 2.0 license.